
The general focus of the research about the stock market has concentrated on analyzing and developing perspectives about the market over the long term. The research primarily relates to secular bull and bear cycles, their patterns of returns and volatility, and the relationships between the market and the underlying fundamental drivers.
Many of the analyses are synthesized into graphics that seek to be self-explanatory. Other postings represent articles that often incorporate and expound upon the graphics.
Please peruse the charts and analyses listed below; we encourage you to send your insights and challenges as catalysts for furthering our research.
You are welcome to use the graphics and quote the text from this website with appropriate attribution and the retention of all copyright designations. Other terms of use are included in the About section.
Featured Items
Last Updated
Oct 9, 2023
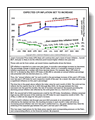
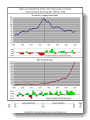
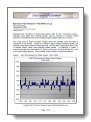
Inflation: Not Done Yet?
The big story for the remainder of 2023 will likely be inflation. Fed Chairman Powell intentionally avoided the implications underlying words like “pause” or “skip” when he said the Fed would “make our decisions meeting by meeting, based on the totality of incoming data.” Let’s look at a structural element that will influence the upcoming inflation data.
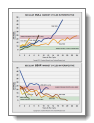
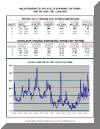
June’s Consumer Price Index (CPI) likely will continue this year’s underlying trend of lower inflation… hurrah! But, mid-year is likely to be the inflection point toward higher inflation reports into year-end. Those calls are far from certain, yet recent history significantly drives the future.
CPI inflation is reported on a year-over-year basis as a percentage increase (or decrease). The percentage change is based on the CPI Index, which is a cumulative measure of price inflation expressed as a number with three decimal places.
For example, May’s CPI Index of 304.127 is divided by May 2022’s CPI Index of 292.296 to calculate an annual inflation percentage rate presented with one decimal place (i.e., 4.0%).
Thus, the “annual inflation rate” for each month is the percentage increase of this year’s CPI Index over last year’s CPI Index for each respective month of the year. As a result, the value last year significantly influences this year’s percentage!
The blue line in this graph reflects the index value for each month of 2022. The solid red line reflects the five reports thus far in 2023 (through May 2023). As the gap between the lines narrowed over the past five months, the rate of increase narrowed (i.e., decreased), providing the declining annual inflation rate reflected by the solid green line (i.e., from 6.4% to 4.0%).
However, the second half of 2022 experienced a stall for the CPI Index. Nonetheless, inflation remained high across 2022 because of the relatively low CPI Index for each respective month of 2021. The STALL in 2022 set the stage for this year’s increase.
If each month’s inflation rate through year-end 2023 proceeds at an annualized 3% rate (as reflected by the dashed red line), the resulting increase in each month’s index will drive an increasing annual inflation rate over last year’s stalled level (i.e., the green dashed line). Note the widening of the expected gap for the next six months between this year’s and last year’s CPI Index.
A constant 0.247% monthly inflation rate (i.e., a 3% annualized rate) for the rest of 2023 is very unlikely. Instead, this analysis aims to identify and communicate key factors that will impact the reported inflation measures through year-end.
The progression of inflation has major implications for the likely press reports (and the corresponding pressure on the Fed)… and the compounding effects that both could have on the financial markets.

Outlook: How Crestmont Research Forecasts
The first principle of investing is that “past performance is not indicative of future results.” Yet, many in the investment industry and investor community rely heavily on the rear-view mirror. Product summaries boast returns for the past 1, 3, 5, and 10 years. Some investors buy currently hot stocks as they cull losers without much regard for their potential. Too often, it’s human nature for us to anchor on yesterday’s trend to extrapolate tomorrow’s outcome.
The most common misunderstanding about Crestmont Research is that its articles and charts follow that industry norm. But, Crestmont’s identification of secular stock market cycles is not based upon recent eras of strong or weak returns. Instead, Crestmont is keenly focused on the outlook for most investors’ horizons—periods of five to twenty years. Secular calls are driven by current conditions and outlook, not by past trends.
This two-page article describes the key principles underlying Crestmont’s research and related charts and writings. It closes with links to selected pieces that epitomize Crestmont’s work.
The Big Shift: A Secular Realignment of Profits and P/E
Why are reported profits for the S&P 500 Index so much higher than normalized profits? Although implied earnings per share (EPS) under Shiller’s CAPE P/E10 and Crestmont’s normalized P/E are expected to be near $90 in 2019, the current forecast for as-reported GAAP EPS is $165.
Why are wages relatively stagnant overall (and declining as a percentage of the economy) while corporate profits increase as a percentage of GDP?
Why does the stock market appear so overvalued to many analysts when, in reality, it may be near fairly valued?
In summary, (1) increased profit margins are the result of slower economic growth; (2) the related increase in EPS will be offset by a lower market P/E and thus will not provide stock market gains; and (3) future returns will remain muted despite an apparently lower level for P/E in the future.
NOTE: the material in this article is so provocative that the concepts are not affecting other material on the website at this time.
Secular Stock Market Cycles
Outlook: How Crestmont Research Forecasts
The first principle of investing is that “past performance is not indicative of future results.” Yet, many in the investment industry and investor community rely heavily on the rear-view mirror. Product summaries boast returns for the past 1, 3, 5, and 10 years. Some investors buy currently hot stocks as they cull losers without much regard for their potential. Too often, it’s human nature for us to anchor on yesterday’s trend to extrapolate tomorrow’s outcome.
The most common misunderstanding about Crestmont Research is that its articles and charts follow that industry norm. But, Crestmont’s identification of secular stock market cycles is not based upon recent eras of strong or weak returns. Instead, Crestmont is keenly focused on the outlook for most investors’ horizons—periods of five to twenty years. Secular calls are driven by current conditions and outlook, not by past trends.
This two-page article describes the key principles underlying Crestmont’s research and related charts and writings. It closes with links to selected pieces that epitomize Crestmont’s work.

Understanding Secular Stock Market Cycles
The concept of secular cycles is sometimes dismissed or misunderstood by investors because they are confronted with a lot of incorrect or contradictory information about these cycles. First impressions can be a powerful force. Adding to the confusion, there are at least three schools of thought about the causes or drivers of secular bulls and secular bears. The principles and theories within those schools are quite different.
The most common school identifies secular cycles based upon chart patterns or average length of past cycles. The second school identifies secular cycles based upon the force of reversion. The members of this school believe that the market’s valuation level is naturally drawn back to its mean over time. The third school believes that secular stock market cycles are driven by fundamental principles of finance and economics.
This article seeks to help you to differentiate the various sources of secular stock market information and understand the basis of their positions. It will explore in detail the principles from the third school and conclude with a quantitative outlook for the stock market environment and expected future returns. This will show that secular cycles are mathematically-driven and not phenomena or coincidences. It will also highlight the need to focus on decade-long periods and not century-long average returns.

Are We There Yet? Secular Stock Market Cycle Status
This new article addresses an increasingly popular question: are we in a secular bear market or a secular bull market? A number of recognized analysts have succumbed to the intoxicating power of the current cyclical bull market and have mistakenly taken up with hope for a longer run. They have adjusted their charts and forecasts to reflect a market charging ahead for years to come. But not everyone agrees. This article presents several secular bull charts and forecasts, then explains why we are still in a secular bear market with little chance of above-average returns over the next decade or so.
…”Of course you’re getting impatient. When will the stock market shift from secular bear to secular bull—or did it already? The implications are significant. Through much of the 2000s and into the 2010s, individual and institutional investors have weathered quite a storm of low returns and high volatility. Are we done being battered? From today, can you reasonably expect above-average secular bull returns like we saw in the 1980s and ’90s … or do we face another decade or longer of below-average secular bear returns?”
Updated
Through Dec 2023
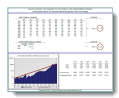
Stock Market Matrix
Returns depend upon the starting and ending point. This series of charts presents the compounded annual returns for an investor who began investing during any start year since 1900 and ending with any subsequent year. The versions presented reflect returns for taxpayers and for tax-exempt or deferred investors, as well as returns on a nominal and real (after inflation) basis. The charts are scaled for printing on a single sheet of 11″ x 17″ paper or on two 8 1/2″ x 11″ pages for subsequent alignment. See the assumptions and legends for important details.
Updated
Through Dec 2022
Secular Cycles Explained
The long-term view of the stock market reflects extended periods of surge and stall. These periods, known as secular bull markets and secular bear markets, are not optical illusions; rather they are extended periods when market valuations (i.e. price/earnings ratios: P/Es) are either multiplying the effect of rising earnings or mitigating them. Secular bull market periods have always started when P/Es were below average, and secular bear markets have never ended when P/Es were above average.
Updated
Through Dec 2022
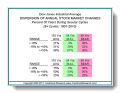
Secular Cycles
The stock market has demonstrated longer-term secular bull and bear cycles. Secular cycles are extended periods with a common trend. In the stock market, these secular cycles are driven by trends in the P/E ratio. This chart presents the secular stock market cycles since 1900, based upon Crestmont’s research and analysis of P/E ratios, inflation, and other factors. The cycles correspond with peaks and troughs in P/E ratios, often over extended periods of years. The P/E ratio cycle corresponds with inflation rate cycles as they move toward and away from periods of price stability (low inflation). A version of the secular chart overlaid with detailed explanations of its key features is also available: Annotated Chart.
Updated
Through Dec 2023
Secular Cycle Dashboard
Mixed signals or confirming signals? There are four variables that determine whether the current secular stock market cycle is in bull or bear territory: price/earnings ratio (P/E), dividend yield, inflation rate, and bond yields. P/E is the pure measure of the stock market valuation level, especially when it is normalized for the business cycle. Dividend yield, directly related to P/E, is a confirming measure that helps to qualify distortions in reported P/Es. The inflation rate is the primary driver of secular stock market cycles. When the inflation rate does not confirm the market’s valuation level, there is likely a cyclical distortion rather than a secular shift or trend (early 2009 is a good example of this contrast). Bond yields, particularly since the 1960s, reflect another financial market perception of the expected future inflation rate. This makes bond yields a confirming measure for secular stock market cycles.
Updated
Through Dec 2022
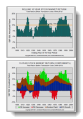
This Secular Bear…So Far
The current secular bear began in 2000 and has lasted well more than a decade. The surges and falls are relatively consistent in both magnitude and duration with past secular bear market cycles. With valuation levels still relatively high as measured by normalized P/E, this secular bear has quite a way to go.
Secular Bear Example
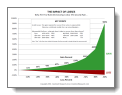
The swings during secular bear markets are much more dramatic than most investors realize. Although secular bull markets have similar swings, they are upward-sloping and are often ignored. The last full secular bear market period delivered 16 years of annual changes and 343% cumulative peak-to-trough movements — thus over 21% per year.
Living Through the Last Secular Bear
In 1972, P/Es were almost 18, the market was approaching and exceeding new highs, volatility was low, and the market was in the first half of a secular bear market. What happened next is now history — if it happens again, that won’t surprise the old sages. This presentation is a self-explanatory look at the last secular bear market cycle and a similarly optimistic period during the first half of that cycle.
Deja Vu
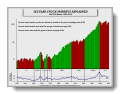
History provides insights when we observe it from the appropriate perspective. The most recent secular cycle, a bull, ran from 1982 through 1999. It was preceded by a secular bear starting in 1965 and ending in 1981. The characteristics of each secular period are reflected in the general direction of the markets and in the frequency of positive returns. As this presentation shows, secular bull periods have generally upward-trending markets and predominately positive (green) annual returns. Secular bear periods are erratic and present a significant number of negative (red) annual returns. The net effect is substantially muted returns due to offsetting positive and negative years. So where are we today? The last secular bear cycle started when the P/E ratio was 23 and inflation was 2%. The current market conditions reflect the same vital signs. Deja vu?
Long-Term Returns

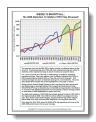
Where Did It Come From: Is the Trend Your Friend?
Since March of 2009, the stock market’s annualized return has averaged more than 17%. Does this portend another strong decade ahead? Hopeful analysts and investors are clinging closely to the old adage “the trend is your friend.”
Yet, is 17% a reasonable expectation? What were the sources for that level of return and will those drivers continue to deliver?
This article discusses the headwaters of total return, the contribution from each tributary over the past eight years, and reasonable expectations for the next decade and longer.
Updated
Through Dec 2023
Components of Return
There are only three components (excluding transaction costs and expenses) to the total return from the stock market: dividend yield, earnings growth, and change in the level of valuation (P/E ratio). To assess the potential returns from stocks for the next decade, this analysis presents the total return and its components for every ten-year period since 1900.

Waiting for Average
The long-term average return from the stock market is 10.1%. As Baby Boomers continue to retire, they will increasingly rely upon their investments and pensions for income. The youngest Boomers have about a decade to compound their savings into a retirement payload. Even younger Millennials have a vested interest in stock market returns for a secure retirement. So, from 2016, what length of time is needed to assure that you will receive the historical long-term average return of 10.1%?
Answer: It will NEVER happen. From today forward, investors from today will not achieve the long-term average return. Not in ten years, twenty years, fifty years, or the nearly ninety years that represent the most recognized long-term average return.

Groundhog Decade for Stocks
Can anyone predict the future? Probably not, but it is possible to analyze the range of potential outcomes. “Groundhog Decade” summarizes some of the key messages of Probable Outcomes. Just as Bill Murray woke up to the same thing day after day in the movie “Groundhog Day,” it’s likely that your outlook foretells a groundhog decade for the stock market that will repeat its near-break-even returns from the past decade!
Updated
Through Dec 2023
Generation Returns
Even an extended period of 20 years does not ensure historically-average cumulative returns in the stock market. Returns are dependent upon the level of valuation (P/E) at the start of the period. When the stock market P/E is relatively high and above the average, investors’ returns over the subsequent 20 years have been below average. When P/E is relatively low and below the average, investors’ returns have been above average and rewarding. [NOTE: the original version of this analysis included an estimate for fees, thus it reflected net total return (as noted in the legend); the current version reflects total return (before fees and expenses).]
Updated
Through Dec 2023
Distorted Averages
Investors can spend only compounded returns (i.e., geometric), not average returns (i.e., arithmetic). This chart presents the difference between average returns and compounded returns for investors. The two issues assessed are the impact of negative numbers and the impact of volatility as measured by the variability within a sequence of returns. Both issues can devastate the actual returns realized by investors compared to the average.
The first issue–negative numbers–is demonstrated by this example: a gain of +20% and a loss of -20% may average zero, yet the net result is a loss regardless of the order in which they occur (100 + 20% = 120 – 20% = 96 or 100 – 20% = 80 + 20% = 96).
The second dynamic–volatility–is illustrated by another example: the compounded return from three periods of 5% returns is greater than any other sequence that averages 5%.
Updated
Through Dec 2023
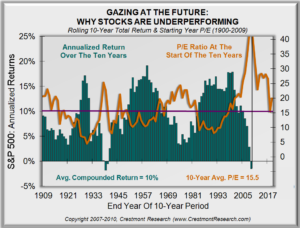
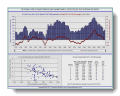
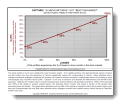
Gazing at the Future
Would it be helpful to have a relatively high degree of confidence about the investment climate for the next 10 years? Would you invest differently if the highly-likely outlook for the next decade would be (1) above-average returns versus (2) below-average returns? Crestmont’s Gazing chart provides the answer. The green bars represent total return (market gains and dividends) for all ten-year periods since 1900. The first bar is 1900-1909, the second bar is 1901-1910, etc. The right-most bar is 2014-2023.
The orange line is the P/E ratio for the market at the start of each ten-year period. The left-most point on the line is P/E for 1900. In other words, the P/E line is shifted to the right by nine years. The P/E line reflects P/E for each year. The bars reflect annualized returns for each rolling ten-year period. The chart aligns the level of P/E at the start of each bar’s decade with that decade’s return. For example, the point on the line above the bar for 2014-2023 is the P/E for 2014.
Keep in mind that P/E drives returns. This happens in two ways. First, the level of P/E drives dividend yield (high P/E causes low dividend yield). Second, the starting level of P/E largely affects whether P/E rises or falls over ten-year periods (Components chart), which adds or detracts from total return. The propensity to rise is greater when P/E is lower. Conversely, P/E is more likely to decline from relatively higher levels.
Here’s the exciting (and insightful) part. The starting P/E for the next nine rolling decades is already known! They occurred from 2015-2023, which correspond to the nine future rolling ten-year periods ending 2024-2033. Note in the Gazing chart that peaks in P/E correspond to troughs in ten-year returns, while toughs in P/E drive the peaks in ten-year returns. Since the next nine starting P/Es are known, the orange P/E line extends into the white space on the right side of the chart. Investors and advisors will experience the rolling decade bars as they fill in, but they can already have a fairly good sense of the environment over the next decade.
Remember, the objective is to predict whether returns for the next ten years (2024-2033) will be above- or below-average. Above-average is possible, but very unlikely. The insights from Gazing about the investment environment help to empower investors to structure portfolios to best succeed over the next decade.
Updated
Through Dec 2023
Stock Market Yo-Yo
Up today and down tomorrow. The stock market seems to be constantly reacting to good news and bad news, sometimes “because of” the news and other times “despite” the news. In this research, we explore the portion of days that the market is up compared to the number of days it is down. Over the past five decades, through secular cycles, decades, and individual years, the range of up-days versus down-days is relatively close to 50%.

Must Be Present to Win (Or Lose?)
Participants in our website have remarked numerous times on the appearance that the market’s gains are limited to a small number of days, raising questions about the value of trying to time the market. Although it is technically true that a few days provide the full year’s return, viewing that phenomenon through too narrow a lens is a bit misleading and seems to be a biased use of statistics. Since almost half of the days or weeks are positive (and thus half or so are negative), the majority offset each other. The result is that a few good days or few bad days “make” the year. Of course, this interpretation completely ignores the fact that certain periods have favorable financial potential (secular bull markets) and certain periods have unfavorable financial potential (secular bear markets). The same logic that encourages investors to stay in the market seeking gains also subjects them to the adversity of down markets.
Shiller Shortfall
Shiller shortfall is its strength. The shortfall relates to the results for 2003 from using the stock market index methodology employed by Professor Robert J. Shiller of Yale University (author of Irrational Exuberance), and many other sophisticated experts. The “index value” of the S&P 500 for each year is based upon the average daily index throughout the entire year rather than on only one point at year-end. The strength of the methodology is that it mitigates the “single-point risks” of using one arbitrary value for each year (i.e. year-end). As a result, the average of all days across the year can better reflect the stock market’s level for that year as a whole. Nonetheless, the results using this methodology can vary significantly from actual reported results. Using 2003 as an example, the average index reflects a decline for 2003 rather than the gains reflected in the year-end values. Even though the index increased by +26% from December 2002 to December 2003, the average index for 2003 was -6% lower than 2002.
Financial Physics
Financial Physics represents the interconnected relationships among several key elements in the economy and the financial markets that determine the stock market’s overall direction. This section and its presentations will provide a highly provocative and insightful perspective on the relationship of the economy (‘the source of wealth’) and the equity markets (‘the measure of equity wealth’). Whereas other sections present analyses of historical data to provide perspectives, this section is dedicated to exploring the fundamental factors and economic relationships that drive trends and valuations in the financial markets.
Updated
Through Dec 2023

Crestmont’s Research: Putting It Together
Guests and clients often ask for a succinct explanation about how to tie together the various elements of research and perspective that are presented within Crestmont’s website. This executive summary represents an initial draft explaining, through a series of steps, the relationships among some of the research. Several of the charts within this website are referenced.
Updated
Through Dec 2023

Financial Physics
This presentation introduces the core “Financial Physics” model. The key factors include Real GDP, Inflation, Nominal GDP, Earnings Per Share (EPS), and P/E Ratio. Since real GDP has been relatively constant over extended periods and all other factors are driven by inflation, a primary driver of the stock market is the inflation rate—as it trends toward or away from price stability. Given the recent state of volatile inflation and the possibility of it either rising (inflation) or declining (deflation), the market P/E ratio may be vulnerable to decline. As the P/E ratio declines and EPS grows, the result could be another relatively non-directional market.
Dissecting Returns
Financial Physics presents the interconnected relationships between certain factors in the economy and the resulting environment in the financial markets. This analysis dissects the components of Total Return and looks at the potential returns available for the rest of the decade. Without further, unsustainable increases in valuation (P/E ratios), returns will likely fall short of the historical average. If inflation remains below the historical average (near 3.5%), economic growth (GDP) and earnings growth (EPS) will also be below the historical average. Future returns from the stock market are likely to be muted if (1) inflation remains stable and earnings grow slowly or (2) if inflation increases and drives P/E ratios lower. Strong stock market returns over the rest of the decade can occur only if P/Es expand further — against the laws of Financial Physics.
P/E Ratio
Updated
Through Dec 2022
Secular Stock Market P/E
The preceding secular bull ended with the market valuation (P/E) at levels twice as high as all previous secular bulls. That meant that this secular bear had twice as much ground to cover. The current secular bear market started to deflate the bubble, but the market still remains at or above levels consistent with secular bear starts.
Updated
Through Mar 2024
The P/E Summary (Quarterly)
This report supplements The P/E Report intra-year with brief commentary and selected charts. Its objective is to provide key information about P/E without including all of the details and explanations included in its annual counterpart.
Updated
Through Dec 2023
(periodic updates)
The P/E Report (Annual)
There are numerous versions of the price/earnings ratio (P/E), yet there are very few of these that can appropriately be compared to the recognized long-term average of 15. The objectives of this report are to detail the current level of the P/E ratio, to answer questions frequently asked about it, and to address the status of the current stock market cycle.
The P/E Report is updated annually; see The P/E Summary for intra-year commentary and selected charts.

Addendum Added
“About Every Five Years…”
The Truth About P/Es
There has been no factor with a greater impact on the variability of investors’ returns over decade-long periods than the trend in the market P/E ratio. History shows that the change in the market P/E ratio over a decade often doubles or halves investors’ returns. This article and its graphs explain P/E, explore its history, and detail its implications. An addendum titled “About Every Five Years…” has been included to discuss periodic distortions in the P/E ratio (including the significant distortion in 2006 and 2007).
Updated
Through Dec 2023
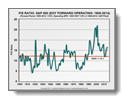
P/E: Forward Operating Averages 12
One of the most significant oversights (or distortions!) in stock market value analysis is the reference to the “historical average” for the price/earnings ratio of the stock market. Too often, the current P/E is based upon an upcoming period (forward earnings) and is based upon a modified version of earnings (operating earnings). That forward-looking, earnings-adjusted P/E is then compared to the historical average for P/E that is based upon the trailing year of as-reported net income. It’s almost like comparing a reading of temperature on the Fahrenheit scale to the Celsius scale. P/E based upon trailing as-reported earnings averages 15-16 (depending upon the period); P/E based upon forward operating earnings averages 11-12. This graph provides a realistic view of the history for forward operating P/E.
Updated
Through 2016
Nightmare on Wall Street
There is compelling evidence that the current secular bear market is still early in its course. This bear will likely have another decade or longer to run, unless over the next few years there is a dramatic change in the inflation rate that decreases P/E substantially. The preceding secular bull ended with the market valuation (P/E) at levels twice as high as all previous secular bulls. That meant that this secular bear had twice as much ground to cover. The last fourteen years have deflated the bubble, but the market still remains at levels consistent with secular bear starts.
Updated
Through Dec 2023
P/E Ratios & Inflation
Conventional stock market wisdom has promoted a fundamental relationship between P/E ratios and interest rates. It has relied upon a key assumption that inflation is positive. As reflected in this chart, P/E ratios increase when the inflation rate trends toward price stability (near 1% inflation) and P/E ratios decline when the inflation rate trends away from price stability. The result is a “Y Curve” effect, where P/E declines into deflation despite low interest rates. This effect is consistent with the modern dividend discount model since earnings and dividends would be expected to decline during deflation and therefore would result in lower valuations.
Updated
Through Dec 2023
P/E Ratio vs. Dividend Yield
The dividend yield of the stock market is relatively low by historical standards. Why? There are two reasons. Many studies present the first reason: corporations are paying a smaller percent of earnings in dividends. Historically, over the past century, the dividend payout ratio has averaged 35% to 60% of earnings. Today, the average payout ratio is near the low end of that range. The second reason, explored by this analysis, is that valuation directly affects dividend yields. As the price-to-earnings ratio (P/E) rises, the price-to-dividends ratio rises as well, thus lowering the dividend yield. This relationship presents another view of the market’s relatively high valuation.

Natural Pinnacle to P/Es
Four reasonable inflation scenarios, a pragmatic analysis, and the standard dividend discount model explain why there is a natural (rational) limit to price/earnings ratios in the stock market. These scenarios reinforce the empirical evidence graphically presented in the “Y Curve Effect.” When inflation permeates the economy, it adversely impacts stock market returns. This analysis is complemented by “Financial Physics” and “The Yield Curve, The Fed, & P/Es.”
Earnings & Economy
Updated
Through Mar 2024
(periodic updates)
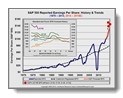
Earnings Trends: History & Future
This graph presents both (1) the historical trend for actual reported earnings per share (EPS), including a forecast by Standard & Poors, and (2) an inset graph presenting the historical record for S&P’s forecast over the past five years. To put the historical trend and future forecast into perspective, the graph includes Crestmont’s assessment of the long-term baseline trend for EPS. Crestmont’s baseline also puts into perspective whether current and forecast EPS are above or below the long-term trend for EPS.
Note: the inset graph reflects S&P’s EPS forecasts for recent years; forecasts begin about two years in advance and proceed until the year is finalized.
Updated
Through 2015

Converging on the Horizon
Beware: there are two series of short-term trends that are converging on their limits. Stock market history and earnings cycle history are converging. The goals of this updated article are (1) to dispel the notion that P/E is low today and (2) to highlight the risks of a decline in 2014 or soon thereafter.
Updated
Through Dec 2023

EPS Reality
The reality is that the business cycle is different than the economic cycle–GDP growth is much more consistent than EPS growth. EPS declines can occur during periods of economic growth. Across the 74 years since 1950, earnings declined during 25 of them despite positive economic growth in all of those years…34%! Real GDP growth (excluding inflation) has lagged the historical 3% average thus far in the 2000s, ’10s, and ’20s. But even if the economy looks positive for the next few years, history highlights that EPS is not immune to decline—especially from such a currently high level of profit margins.
Updated
Through Dec 2023
It’s Not the Economy
Despite the general contention that the economy and the stock market are inexorably connected, the facts get in the way of confirming common wisdom. This chart presents the average stock market return and average GDP growth by decade and by bull/bear market cycle. Economic growth is not the primary driver of stock market returns; instead, returns are driven primarily by a cycle in the P/E ratio. Although economic growth does increase the denominator in the P/E (earnings), actual returns are generally the result of trends in the P/E ratio. This and other research that Crestmont has conducted dispels this conventional notion.

Beyond The Horizon: Redux 2011
As of May 2011, profit margins were cyclically high, near historical highs, and already at unsustainable levels, with projected further increases over the next two years. Beware. Rather than rehash old ground, this article provides a speed-round of charts and limited commentary to explain conditions as of 2011 and the expectation for an earnings decline within the next few years. For the full explanation of the concepts relating to this article, please see “Beyond The Horizon: The EPS Cycle” and “Back To The Horizon: EPS Cycles Again,” immediately below. Once again, since the fundamental principles of the business cycle cause history to repeat itself, a decline in EPS should not be beyond your horizon!
Last Updated
Dec 2008

Back to the Horizon
Earnings had been increasing at double-digit growth rates for five consecutive years from 2002 through 2006-although many agreed that earnings growth might be slowing, it was beyond almost everyone’s foreseeable horizon that earnings might actually experience a decline. Yet, before anyone knew it, the end of the cycle was in the rear-view mirror rather than beyond the distant horizon. This article is a follow-up to “Beyond The Horizon: The EPS Cycle” (located above).
(revised with recent data; EPS graphs update)
Beyond the Horizon
Earnings have increased at double-digit growth rates for five consecutive years — it’s beyond almost everyone’s foreseeable horizon that earnings might soon experience a decline. Despite the statistics about average earnings growth, the business cycle drives periods of surge and stall. This analysis explores the earnings growth cycle, the profit margin cycle, and then translates the outlook into specific implications for returns over the next decade. As an analogy, winter is not a time for farmers to hibernate; rather it’s a period to approach crops differently. Today’s investors have so many tools and techniques available to them to actively “row” and invest like institutions, thereby seeking relatively consistent returns with a lot less risk of disappointment.
Updated
Through Dec 2020
Siegel’s Shortfall
For a decade, Jeremy Siegel criticized the validity of Robert Shiller’s version of the cyclically adjusted price/earnings ratio (aka CAPE and P/E10) because of a supposed distortion of P/E10 due to the earnings plunge in 2008. In reality, for most of the past decade, the magnitude of above-trend profit margins more than offset the deep-yet-short 2008 chasm.
Reported earnings for the S&P 500 is highly variable, as reflected in the graph by a blue line. Therefore, a price/earnings ratio (P/E) based upon Reported EPS will often be distorted when Reported EPS is above or below its long-term trend (i.e., almost all years).
This chart provides three key insights about CAPE P/E10 and the benefits of normalizing EPS: (1) 2008 is no longer in current reports of P/E10, and 2008 caused minimal distortion in retrospect, (2) normalizing P/E is essential to avoid distortion from the Reported EPS cycle, and (3) EPS for the past 10 years includes only high profit margin conditions; the economy and S&P 500 may find the next few years will have below-average profit margins.
Market Volatility
Updated
Through Mar 2024
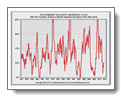
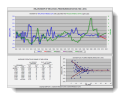
Stock Market Volatility: An Erratic Cycle
By popular request, this chart of historical stock market volatility will be produced separately and updated regularly. It appears as a key graph in the article Volatility in Perspective.
This graph reflects a measure of stock market volatility–the statistical standard deviation of monthly changes for the S&P 500 Index. The line on the graph reflects volatility for each trailing twelve-month period starting in January 1951 and continuing with each month to present. There are several insights from the graph. First, volatility is volatile; it cycles erratically over time. Second, periods of extremely high or low volatility often follow the other. Third, volatility tends to spend most of its time around the average (i.e., within 25% above or below the average).
High or rising volatility often corresponds to declining markets; low or falling volatility is associated with good markets. The current period of low volatility is a reflection of a good market, not a predictor of good markets in the future.
Note: New VIX chart included in this set…
Updated
Through Dec 2022
Significant Swings
Although the compounded average annual change in the stock market is near 5% over the past century, the range of dispersion in annual returns is dramatic. This chart presents the distribution of yearly index changes within the single-digit range of -10% to +10% during the past century overall and during the secular bull and bear cycles. In addition, a second range was determined to include half of the years within the range and half of the years outside the range. More than 50% of the years ended with changes in the index exceeding +/-16% (either greater than -16% or greater than +16%).
Updated
Through Dec 2023
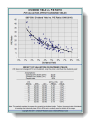
Stock Market Returns & Volatility
This analysis presents an uncanny relationship between stock market performance and the volatility of the market. We do not assert a causal relationship; rather, the coexistence of the relationship implies that many measures of risk actually compound in declining markets. By contrast, the reward-to-risk relationship improves significantly in strong markets. In the context of secular bull and bear markets, this relationship further emphasizes the need to consider risk as well as reward in an investor’s investment decisions.
Updated
Through Dec 2023
Volatility in Perspective
Is the current level of volatility “normal”? If so, it’s a new normal! The purpose of this presentation is to graphically put volatility into historical perspective. This report will be updated periodically as volatility itself is just too volatile to be ignored.

Calm Before the Storm
In April 2005, “A Minsky Review” explored the risks and implications of low volatility in the markets. That analysis predicted an increase in market volatility by the end of 2006. One year later, as of April 2006, volatility had plunged further, into the lowest five percent of all periods since 1950. With numerous new and updated charts and graphs, this article explains that “the tectonic plates of the markets are intensely balanced in an edgy state of latent eruption.” Beyond presenting an assessment of current conditions (2006), this analysis, based upon the lessons of history, discusses the timing and implications of a reversal to rising volatility.

A Minsky Review
April 2005: Judging from the level of complacency in the stock market, some of you may not care to make it to the second paragraph of this article -— Hyman Minsky warned us about times like this! Those of you who stay until the end will find a compelling case that four indicators portend a significant decline in the stock market and a rise in volatility before the end of next year (2006). For those with financial exposure to the stock market today, you may be compelled to act. For those of you that have already hedged your positions, this article will provide the insights as to when to increase your exposure again. And for the complacent readers, save this for later reference to explain “why.”
Investment Implications
The Big Shift: A Secular Realignment of Profits and P/E
Why are reported profits for the S&P 500 Index so much higher than normalized profits? Although implied earnings per share (EPS) under Shiller’s CAPE P/E10 and Crestmont’s normalized P/E are expected to be near $90 in 2019, the current forecast for as-reported GAAP EPS is $165.
Why are wages relatively stagnant overall (and declining as a percentage of the economy) while corporate profits increase as a percentage of GDP?
Why does the stock market appear so overvalued to many analysts when, in reality, it may be near fairly valued?
In summary, (1) increased profit margins are the result of slower economic growth; (2) the related increase in EPS will be offset by a lower market P/E and thus will not provide stock market gains; and (3) future returns will remain muted despite an apparently lower level for P/E in the future.
NOTE: the material in this article is so provocative that the concepts are not affecting other material on the website at this time.

RECENT
Serious Implications: Forecast Skew Over the Next Decade
This article describes and demonstrates the serious implications of forecast skew for long-term stock market returns. Spoiler alert: Most forecasts for stock market returns from Wall Street analysts average near 6% annually. However, there is almost no chance of a 7% annualized return for the next decade, but high chance that it’s between 0% and 6%. This outlook should be empowering, not concerning. There is a lot that can be done by and for investors to achieve success even when returns from the stock market are so far below average.
Insights include: (1) the stock market is random from year-to-year, yet highly predictable over decade-long periods, (2) EPS growth is slightly slower than GDP-N growth during almost every historical period for fundamental reasons, and (3) random diversification is good; intentionally-structured diversification is even better—for investment success, it’s important to understand the current stock market environment, the range of outlooks for the next decade, and the principles that drive stock market returns over investors’ horizons.

FAVORITE
Reconciliation Principle: Returns & Forecasts Must Add Up
Hope springs eternal… until it confronts reality. The past 17 years have led investors to challenge conventional wisdom and to seek a deeper understanding of the stock market. Crestmont’s Reconciliation Principle enables advisors and investors to peel back the cloak and see the fundamental principles that drive the market. It’s empowering! The Principle enables investors to see that the current high P/E destines the stock market to an extended period of below-average returns, but it also helps them to take the actions necessary to achieve long-run investment success.
This article explores the value of understanding and assessing the environment over your investment horizon. Market weather may be hard to predict, but market climate can be credibly determined.

Exit from Wonderland
Why have sailing strategies over-performed and rowing strategies underperformed in recent years? Are there reasons to expect anything different in the next few years? How should equities be weighted in portfolios and should alternatives be included?
The financial world is operating just as the Fed has intended. With good intentions, the Fed used 0% interest rates and a $4.5 trillion QE bond-buying program to stimulate the economy and the stock market. The Fed’s actions intentionally distorted market relationships, which alter the effectiveness of skill-based and value-oriented investment strategies. The repeating pattern—and unprecedentedly long era—of interest-rate and bond-market interventions now has many investors capitulating to a new world outlook.
Catalysts and conditions are ripening for a reversal of recent patterns. The catalysts were not on the near horizon even a year or two ago. Portfolio diversification and risk hedging are more important now than they have been in quite a while.
Updated
Through Dec 2023

Half & Half: Why Rowing Works
This article addresses two key questions for investors today: why do secular stock market cycles matter and how can you adjust your investment approach to enhance returns? Secular cycles do matter, and the expected secular environment should drive your investment approach. The investment approach that was successful in the 1980s and 1990s was not successful in the 1970s nor over the past 14 years. Therefore, an insightful perspective about market conditions will determine whether you have the right portfolio for investment success over the next decade and longer. Now, assume for a moment that you must pick one of two investment portfolios. The first is designed to return all of the upside — and all of the downside — of the stock market. The second is structured to provide one-half of the upside and one-half of the downside. Which would you pick?
The Impact of Losses
There is a very important reason that Warren Buffet’s “first rule of investing” is also the second rule: it takes a lot of gain to make up for losses. This graphic highlights a key lesson of investing.
Last Updated
Apr 5, 2013

Game Changer
MARKET BEWARE SLOWER ECONOMIC GROWTH
There are numerous perspectives about future economic growth. The latest tally includes about 1.5 opinions per economist (reflecting economists’ penchant for the phrase “on the other hand”). Some economists are more optimistic, others more pessimistic, and more than a handful position themselves on both sides of the fence. This article discusses the long-term implications for slower growth in the stock market. Whether your preferred economist advocates 2%, 1%, or 0% long-term growth, the outcome is similar in direction though varying in magnitude. The impact of near-stagnant growth will lie somewhere between bad and worse. Historically, the prospect of slower economic growth has not often been considered by economists and analysts, but it is now accepted in mainstream thinking. The implications of slower growth on stock market returns will be dramatic for investors.

Row, Not Sail
For boatsmen, the history of rowing started more than 8,000 years ago; sailing is a relative newcomer, arriving on the scene about 3,000 years later. Likewise, for investors, the “rowing” approach to investing precedes the more modern “sailing” approach of passively buying and holding securities to realize the returns provided by the market. Crestmont Research and Ed Easterling brought together the two concepts as chapter 10 of Unexpected Returns, introducing the analogy that contrasts two vastly different investment approaches. The current secular bear market has driven investors and financial advisors to seek progressive skill-based absolute return investments, rather than to rely upon the more passive and traditional relative return investments. This excerpt from the beginning of the chapter summarizes the contrast. Investors, financial advisors, and money managers are welcome to use this analogy and this excerpt to foster a broader appreciation for the need to adjust investment strategy to the market environment (Of course, we hope that you’ll remember and recognize Crestmont Research in the process…).

Portfolio Mismanagement
If the first rule of portfolio management is diversification, why do most investors unwittingly concentrate their risks? Many investors believe that a portfolio constructed with numerous stocks and bonds is diversified. That approach has its roots in the principles of Modern Portfolio Theory (MPT). Yet when MPT is misapplied, it does not provide the roadmap to secure investing and leaves investors vulnerable to substantial risk. This article explores why the strategy of diversification in a portfolio should apply to risks rather than to securities. Most investors have unknowingly folded a significant concentration of risk into their investment portfolios.

Markowitz Misunderstood
Harry Markowitz published his research titled “Portfolio Selection” in The Journal of Finance in 1952. He began the paper by parsing the portfolio selection process: “The process of selecting a portfolio may be divided into two stages. The first stage starts with observation and experience and ends with beliefs about the future performances of available securities. The second stage starts with the relevant beliefs about future performances and ends with the choice of the portfolio. This paper is concerned with the second stage.” In this article, we’ll consider the implications of the first stage, which is crucial to investors’ success in current market conditions.

Destitute at 80: Retiring in Secular Cycles
There has never been a thirty-year period for the stock market during which investors have lost money; yet there have quite a few thirty-year periods that have bankrupted senior citizens who were relying upon their stock portfolios for retirement income. Although history provides an average outcome across a wide variety of market conditions, it is relevant to consider only those periods with characteristics similar to those we see today. Given the significant impact of valuation on returns, valuation will be a major driver for today’s investors and retirees.

Rowing vs. the Roller Coaster
Why are so many of the most knowledgeable institutions and individuals shifting away from investment portfolios that have been concentrated in stocks and bonds toward a more diversified and risk-managed profile? The tools and resources are now available to permit investors at all levels to use this enhanced approach and be successful. This article describes the dynamics and benefits of seeking more consistent, absolute returns rather than investing simply for the relative returns of the stock market.

Looming Crisis
LOOMING CRISIS: STATE BUDGETS SOON TO BE UNDER SIEGE
Public employee retirement systems across the nation have a major problem. Almost all of these pension plans currently assume investment returns that are well beyond levels that are reasonably achievable going into the future. The result is that they appear better funded than they really are. Ultimately, the inevitable and substantial shortfalls that result will become the responsibility of taxpayers.
The current shortfalls are not, as conventional wisdom asserts, the one-time result of a stock market decline in 2008. The shortfalls are the result of the gap between faulty assumptions and actual returns, a gap which will ensure an ever-widening shortfall. Most policy makers assume that their recent provisions to address the shortfall will cure the problem over upcoming decades. Instead, the hole is many times larger than they believe. Some policy makers have even started advocating “reforms” that will burden the pension plans in order to fund programs outside of the plans.
There are significant implications for investors, taxpayers, plan beneficiaries, and other constituents. A wrongly-diagnosed problem leads to ineffective solutions and worsened conditions.
Updated
Through Dec 2023
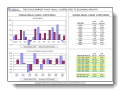
Up & Down Capture Graph
The simple analysis -– graphed. Many “rowing” strategies (active, diversified, risk-managed, reduced or no market correlation, etc.) are criticized for not achieving returns during market declines and then not being able to beat the stock market on the upside. The counter-argument: if an investor can avoid the losses, it takes only a fraction of the positive gains to match (or beat!) the market. So the main objective of “rowing” is to avoid the losses; the gains will seem to take care of themselves.
Updated
Through Dec 2023
Up & Down Capture
A simple analysis–a powerful statement. What percent of the gains during positive months is needed to achieve stock market returns if an investor avoids losses during declines? Many “rowing” strategies (active, diversified, risk-managed, reduced or no market correlation, etc.) are criticized for not getting much return during market declines and then not being able to beat the stock market on the upside. The answer: if an investor can avoid the losses, it takes only 26% of the positive gains to match the market. And, if losses are confined to 50% of the market drop, it takes only 62% of the gains to achieve market returns. So the main objective of “rowing” is to avoid the losses; the gains will seem to take care of themselves.
Impact of Rebalancing
“Row, Not Sail.” In strongly trending markets such as secular bull markets, the best strategy is to get fully invested and remain so. Let the profits and over-allocation in equities compound to your benefit. In choppy and volatile markets, an approach involving more frequent rebalancing can add significant additional return to an investor’s portfolio. Based upon recent secular market history, the risk (cost) of more frequent rebalancing in secular bull markets is far less than the opportunity derived from more frequent rebalancing in secular bear markets. Rebalancing is the active management technique that capitalizes on market cycles. Over-performance in one category (asset class) is shifted to another category to benefit from the second category’s later good performance.