
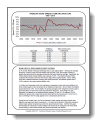
Today we understand that interest rates have a strong fundamental relationship with inflation, a relationship that is expected to generate prompt interest rate adjustments when the rate of inflation changes. Prior to the mid-1960s, the relationship was much less consistent. As a result, the validity of interest rate-related analyses prior to the mid-1960s should be closely reviewed. The terms of use for all materials are detailed in the About section.
Jump to Section:
Interest Rate History
Updated
Through Sep 2024
Bond Yields: Reasonable Expectations
Is 4% on the 10-year Treasury note high, low, or just about right? The Fed appears to be targeting inflation near 2% (although that commitment is quite uncertain). Adding a 2% inflation-risk spread, 4% or so may be just about right for the 10-year note.
Updated
Through Dec 2023
The Yield Curve, the Fed, & P/Es
Interest rate increases by the Fed, when they occur, should preserve stock market P/Es, not impair them…unless these are not successful in controlling inflation or drive us back into deflation. Increases in short-term rates are intended to contain the inflation rate, the driver of P/Es and long-term interest rates. The implication of a 100-basis-point (1%) yield spread is that the interest rate that affects stocks, the long-term rate, is likely to stay relatively low as long as the inflation rate remains low near price stability.
Updated
Through Dec 2023
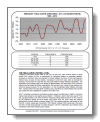
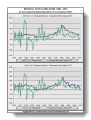
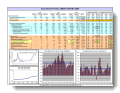
The 6/50 Rule
For more than 50 years, (with limited exceptions, about 4% of the weeks), there has not been a 6-month period during which interest rates did not change at least 50 basis points. The reality is that interest rates are much more volatile than most investors realize. As history demonstrates, almost a third of the time, interest rates change by more than 1% (and over 20% in percentage terms) over all 6-month periods. This set of charts and statistics (a total of five pages) presents the data and a boundary guideline that we can expect interest rates to cross over the next six months.
Updated
Through Dec 2023
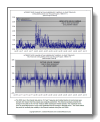
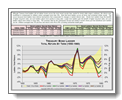
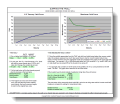
The 10-Year Treasury Note
The 2003 rise in the interest rate on 10-year Treasuries (and related decline in bond prices) was dramatic. This historical analysis presents the change in the yield on the 10-year Treasury within subsequent 8-week periods. The magnitude of the move in percentage terms is much more significant than the change in absolute terms. Although there have been a number of 1% (100-basis-point) changes in interest rates, that was the first change in rates that topped 30% of the starting interest rate level. Since then, the decline in volatility that we have seen across many financial markets has occurred in the Treasury note market, too.
Updated
Through Dec 2023
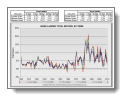
Interest Rates & Inflation
The fundamental relationship that is widely accepted today–that interest rates, particularly long-term rates, are directly affected by the rate of inflation–was not apparent during the first two-thirds of the past century. This historical reality creates significant implications for the use of historical interest rates prior to the 1960s…or casts doubts as to the relationship between interest rates and inflation.
Updated
Through 2017
Dynamic History
Take a tour of interest rates, financial indicators, and markets over the past century. This model reflects the history of interest rates since 1900. The model dynamically presents the yield curve across each year. The yield curve is the graphical depiction of interest rates across maturities from one to twenty years. Short-term rates are often different from longer-term rates, and the level of interest rates has changed over time. In addition, the model provides a historical perspective on inflation, economic growth, and stock market changes.
If you choose not to enable the macro that provides a dynamic display over time (look for the “Start” button in the upper right corner), you will have manual control over the progression across the century (in the lower left corner). Look for instructions in the lower right corner. Three versions are provided to best suit your screen resolution (a larger size is recommended).
Investment Implications
Updated
Through 2023
Ladder in a Bear
Although Treasury bond ladders did not deliver losses across the most recent secular bear market for bonds (1950–1980; date range is arbitrary), the returns were insufficient to compensate for inflation, which averaged more than 4% for the period. Note that bond ladders across all terms had somewhat similar results. This consistency occurs because bond ladders have internal mechanisms that compensate for changes in market interest rates. Shorter-term ladders forgo the benefits of higher long-term rates, but such ladders adjust more quickly to rising rates. Longer-term ladders gain the benefit of higher long-term rates, but such ladders adjust more slowly to rising rates. The summary data for the subsequent secular bull market in bonds shows just how beneficial such markets can be — inflation averaged near 3%, and thus real returns were 4% to 6%+, providing substantial wealth gains.
Updated
Through Dec 2023
Climb the Ladder
Fixed-income investors have been paralyzed by the fear of rising interest rates. Many investors have elected to hold cash rather than to reinvest farther out on the yield curve in maturities that offer higher interest rates. Bond market pundits are calling for higher interest rates in the near future (keep in mind that most are providing perspectives consistent with the past twenty years, when inflation was being controlled downward by the Fed, rather than in an environment characterized by the conditions that exist today). Although an immediate rise in interest rates does cause a decline in the value of bonds, the loss of higher yields investors incur while they wait for better prices can be significant. This analysis of historical interest rates shows that simple bond ladders, particularly maturities of 10 years and less, did not experience annual losses any time over the past century. A simple bond ladder may be one of the best approaches for fixed-income investing as the potential for rising rates looms. A bond ladder is a portfolio of bonds with a portion of the portfolio maturing each year (often equal amounts across each annual maturity). A bond ladder can be as short as two years or as long as 30 years or more.
Surfing the Roll
The yield curve reflects the interest rate relating to each maturity year presented on a graph. Since long-term interest rates are generally different from short-term interest rates (normally, longer term rates are higher), the graph has a slope or curve to it. This analysis presents an assessment of the impact of buying a bond and enjoying the built-in appreciation that occurs as a normally higher-interest-rate bond becomes a valuable shorter-term bond (the “roll”). Obviously, changes in overall interest rates affect both positively and negatively the impact of “rolling” down the curve. However, this dynamic provides some built-in protection against the adverse impact of rising interest rates and helps investors who want to increase the yield of their portfolio by investing in longer-maturity fixed-income securities (bonds).
Other
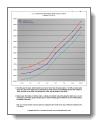
Grossly Misunderstood Debt
The chart that has often cited by Bill Gross and others, as reflecting a surge in total credit market debt as a percentage of GDP, is distorted by a number of factors. One of the most significant of these factors is that many families have substituted mortgage payments for rents and have thus increased their debt ratio without changing their costs. Ironically, the shift has built significant equity value. Further, when the long-term series is viewed on a standard logarithmic scale to show percentage gains over time, the chart becomes much less dramatic. On a real basis, adjusting for inflation, the rate of growth has been relatively constant over the past 50 years.