
Updated
Through Dec 2023
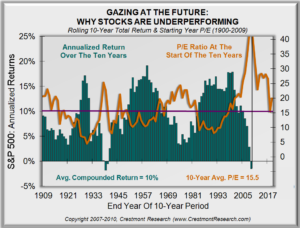
Gazing at the Future
Would it be helpful to have a relatively high degree of confidence about the investment climate for the next 10 years? Would you invest differently if the highly-likely outlook for the next decade would be (1) above-average returns versus (2) below-average returns? Crestmont’s Gazing chart provides the answer. The green bars represent total return (market gains and dividends) for all ten-year periods since 1900. The first bar is 1900-1909, the second bar is 1901-1910, etc. The right-most bar is 2014-2023.
The orange line is the P/E ratio for the market at the start of each ten-year period. The left-most point on the line is P/E for 1900. In other words, the P/E line is shifted to the right by nine years. The P/E line reflects P/E for each year. The bars reflect annualized returns for each rolling ten-year period. The chart aligns the level of P/E at the start of each bar’s decade with that decade’s return. For example, the point on the line above the bar for 2014-2023 is the P/E for 2014.
Keep in mind that P/E drives returns. This happens in two ways. First, the level of P/E drives dividend yield (high P/E causes low dividend yield). Second, the starting level of P/E largely affects whether P/E rises or falls over ten-year periods (Components chart), which adds or detracts from total return. The propensity to rise is greater when P/E is lower. Conversely, P/E is more likely to decline from relatively higher levels.
Here’s the exciting (and insightful) part. The starting P/E for the next nine rolling decades is already known! They occurred from 2015-2023, which correspond to the nine future rolling ten-year periods ending 2024-2033. Note in the Gazing chart that peaks in P/E correspond to troughs in ten-year returns, while toughs in P/E drive the peaks in ten-year returns. Since the next nine starting P/Es are known, the orange P/E line extends into the white space on the right side of the chart. Investors and advisors will experience the rolling decade bars as they fill in, but they can already have a fairly good sense of the environment over the next decade.
Remember, the objective is to predict whether returns for the next ten years (2024-2033) will be above- or below-average. Above-average is possible, but very unlikely. The insights from Gazing about the investment environment help to empower investors to structure portfolios to best succeed over the next decade.