
Some people will identify with the long-term view; others will be curious to see the effect that the secular cycles have on their own investment horizons. Ten years is generally considered long enough to smooth the yearly ups and downs in the market. Many people expect that the cumulative return over ten-year periods will begin to concentrate near the long-term average return of 10%.
There have been 101 rolling ten-year periods since 1900, covering more than a century of stock market history and numerous secular stock market cycles. Many of the ten-year periods include years from both secular bulls and secular bears, while others are exclusively within an individual secular cycle. The result is not a muted or random profile of returns—the secular cycles have a profound impact across periods of ten years and longer.
Of course, very few if any ten-year periods will have total returns (including dividends) of exactly 10%. Instead, consider your expectation that annualized returns fall within a range around 10%. What percent of the time across the 101 ten-year periods did annualized returns, including dividends, fall within the fairly wide range of 8%–12%?
This is clearly relevant to the probable outcomes for stock market returns over this decade. Many investors and advisors either implicitly or explicitly assume that stock market returns for this decade will be inside the 8%–12% range. This is especially true considering that the assumption by many investors for overall investment portfolio returns is 8% or more.
Consider that the expectation for returns from a portfolio includes a blending of assumptions, combining relatively higher stock market returns with much lower bond investment returns and, for some investors, returns from alternative investments. For the blended portfolio to generate overall returns of 8% after expenses, stocks may need to return 12% or more to offset bond returns that are likely to be less than half that. Alternatively, some investors are concentrating more heavily in stocks because of the low bond yields.
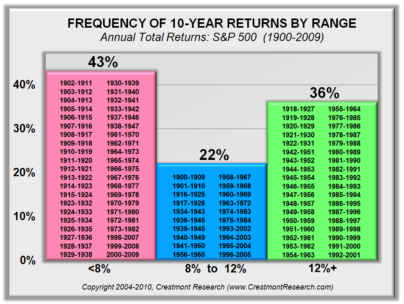
Nonetheless, many investors assume that stock market returns over this decade will be inside the range of 8%–12%. As figure 9.3 reflects, the annualized total return from the stock market over ten-year periods has been inside the 8% to 12% range less than one-quarter of the time!
Just over one-third of the time (36%), annualized ten-year returns exceeded 12%. The remainder of the ten-year periods, 43%, delivered annualized returns over the decades that were less than 8%.
Figure 9.3. Frequency of 10-Year Returns by Ranges

As reflected in the graph, the columns list the respective ten-year periods. The periods are not random; rather, they run in series that reflect the fluctuating trend in P/E as driven by the inflation rate. Returns in the rightmost column, reflecting periods with returns in excess of 12%, are all periods when P/E started at less than 15. For the leftmost column, with returns below 8%, the starting P/E was generally above 15. With P/E starting this decade near 20, it is almost certain that the next ten years ultimately will find its place in the left column.