
Updated
Through Dec 2023
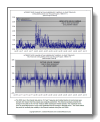
The 10-Year Treasury Note
The 2003 rise in the interest rate on 10-year Treasuries (and related decline in bond prices) was dramatic. This historical analysis presents the change in the yield on the 10-year Treasury within subsequent 8-week periods. The magnitude of the move in percentage terms is much more significant than the change in absolute terms. Although there have been a number of 1% (100-basis-point) changes in interest rates, that was the first change in rates that topped 30% of the starting interest rate level. Since then, the decline in volatility that we have seen across many financial markets has occurred in the Treasury note market, too.