
Updated
Through Jun 2024
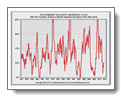
Stock Market Volatility: An Erratic Cycle
By popular request, this chart of historical stock market volatility will be produced separately and updated regularly. It appears as a key graph in the article Volatility in Perspective.
This graph reflects a measure of stock market volatility–the statistical standard deviation of monthly changes for the S&P 500 Index. The line on the graph reflects volatility for each trailing twelve-month period starting in January 1951 and continuing with each month to present. There are several insights from the graph. First, volatility is volatile; it cycles erratically over time. Second, periods of extremely high or low volatility often follow the other. Third, volatility tends to spend most of its time around the average (i.e., within 25% above or below the average).
High or rising volatility often corresponds to declining markets; low or falling volatility is associated with good markets. The current period of low volatility is a reflection of a good market, not a predictor of good markets in the future.
Note: New VIX chart included in this set…