
Updated
Through Dec 2022
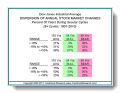
Significant Swings
Although the compounded average annual change in the stock market is near 5% over the past century, the range of dispersion in annual returns is dramatic. This chart presents the distribution of yearly index changes within the single-digit range of -10% to +10% during the past century overall and during the secular bull and bear cycles. In addition, a second range was determined to include half of the years within the range and half of the years outside the range. More than 50% of the years ended with changes in the index exceeding +/-16% (either greater than -16% or greater than +16%).