
Updated
Through Dec 2022
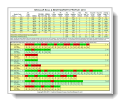
Secular Cycles
The stock market has demonstrated longer-term secular bull and bear cycles. Secular cycles are extended periods with a common trend. In the stock market, these secular cycles are driven by trends in the P/E ratio. This chart presents the secular stock market cycles since 1900, based upon Crestmont’s research and analysis of P/E ratios, inflation, and other factors. The cycles correspond with peaks and troughs in P/E ratios, often over extended periods of years. The P/E ratio cycle corresponds with inflation rate cycles as they move toward and away from periods of price stability (low inflation). A version of the secular chart overlaid with detailed explanations of its key features is also available: Annotated Chart.