
Updated
Through Dec 2023
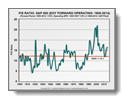
P/E: Forward Operating Averages 12
One of the most significant oversights (or distortions!) in stock market value analysis is the reference to the “historical average” for the price/earnings ratio of the stock market. Too often, the current P/E is based upon an upcoming period (forward earnings) and is based upon a modified version of earnings (operating earnings). That forward-looking, earnings-adjusted P/E is then compared to the historical average for P/E that is based upon the trailing year of as-reported net income. It’s almost like comparing a reading of temperature on the Fahrenheit scale to the Celsius scale. P/E based upon trailing as-reported earnings averages 15-16 (depending upon the period); P/E based upon forward operating earnings averages 11-12. This graph provides a realistic view of the history for forward operating P/E.