
Updated
Through Dec 2023
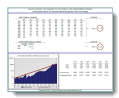
Distorted Averages
Investors can spend only compounded returns (i.e., geometric), not average returns (i.e., arithmetic). This chart presents the difference between average returns and compounded returns for investors. The two issues assessed are the impact of negative numbers and the impact of volatility as measured by the variability within a sequence of returns. Both issues can devastate the actual returns realized by investors compared to the average.
The first issue–negative numbers–is demonstrated by this example: a gain of +20% and a loss of -20% may average zero, yet the net result is a loss regardless of the order in which they occur (100 + 20% = 120 – 20% = 96 or 100 – 20% = 80 + 20% = 96).
The second dynamic–volatility–is illustrated by another example: the compounded return from three periods of 5% returns is greater than any other sequence that averages 5%.