
Economic growth unexpectedly declined in the decade of the 2000s and slow growth has continued into the 2010s. Initially, it may have been a normal cyclical variation, yet it is increasingly appearing to portend a future of slower economic growth. Economic growth and the inflation rate have significant implications for future long-term stock market returns. New postings and updates will be noted in the Recent Additions section of this website. The terms of use for all materials are detailed in the About section.
Jump to Section:
Economic Growth
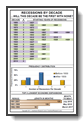
Recessions By Decade: Record on the Horizon
The current expansion, which started in June 2009, is now the longest in recorded history since the 1850s. The current expansion became the second longest in May 2018 and, in July 2019, it became number one. But most of all, if the current expansion endures to January 2020, then it will mark the first calendar decade (the 2010s) without a recession.
Recessions are relatively common and frequent. Before 1930, recessions occurred equally 1 to 4 times per decade. After 1930, recessions occur once per decade about a third of the time and twice per decade about two-thirds of the time. If history is a guide, we should expect 1 to 2 recessions each decade.
The current slow, long expansion has come at great cost. Had this expansion simply grown at the historically-average rate for expansions, the economy, standards of living, and average worker incomes would be more than 20% higher than they are today.
Even if such growth over the past decade had been punctuated with a typical recession, the economy and standards of living would be more than 10% higher. No wonder we have a current environment of economic frustration.
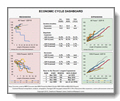
Economic Cycle Dashboard
The current economic expansion, so far, is currently the fourth longest on record (out of 34 since 1854). This chart compares the duration and magnitude of the current expansion to historical averages. Economists often review the economic cycles after 1950 as a separate set. Therefore, the historical averages are presented with all years since 1854 and the years since 1950. You will see that the current expansion is considerably slower than the historical averages and slower than 90% of all past expansions.
Slow-and-steady has come at a great cost to wage growth and standards of living. Had this expansion been simply the modern average, wages and standards of living would be 18% higher today than they are after slow-and-steady! (“Expansion” is the most appropriate term for the growth period that follows a “recession.” Not only must expansions happen first–the first economic step could not have been a recession from zero!–but also recessions are periods of correction for misalignments that occur during preceding expansions. Further, the term “recovery” implies that actions might be needed to “fix” the economy from a recession, rather than to allow the natural forces of population growth and productivity to deliver economic expansion.) Nonetheless, the economy is in a race to a new longevity record: third place next March 2017 and first place in July 2019. The age of the current expansion also represents a risk for the stock market should a recession end its run.
Updated
Through 2019
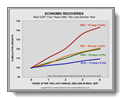
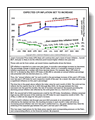
Worst Recovery Since…Ever?
It has been said repeatedly that the current sluggish economy is the result of the recent “worst recession since the Great Depression.” It’s probably time to reassess the medicine, rather than continue to blame the illness.
This chart does not advocate a particular economic policy, rather it provides contrasts of historical experience. The rate of economic growth can have a significant effect on stock market valuation, the market P/E, and future returns: See Game Changer
Updated
Through Dec 2023
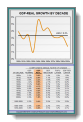
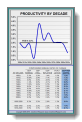
GDP – Real Economic Growth
Economic output, as measured by real gross domestic product, reflects the amount of goods and services produced by labor and capital in an economy. The change from period to period, excluding the effects of inflation, measures the real economic growth occurring within the economy. Economic growth has been relatively consistent over many decades in the U.S., as a result of fairly constant population growth and generally consistent productivity gains (at least in the longer-run). During the 1930s, economic growth stalled; it then subsequently recovered its long-term average growth rate through an above-average decade in the 1940s. Real GDP during the past three calendar decades was significantly below average. It’s beginning to appear the economy downshifted to a new level of slower growth. This could have significant implications for the stock market over the next few decades.
Updated
Through Dec 2023
GDP & Economic Productivity
Economic growth, as measured by GDP, is driven by two components: population growth and labor productivity. Labor productivity reflects the capacity for increased output from the existing quantity of labor in the economy. Various government agencies and independent analysts produce measures of labor productivity. For high-level analysis of the second component of economic growth, a productivity measure using overall economic production provides the most comprehensive and consistent measurement of economic productivity.
Updated
Through Dec 2023
GDP & Population Growth
Economic growth, as measured by GDP, is driven by two components: population growth and labor productivity. Population growth represents a surrogate measure of the quantity of labor in the economy. Although there are numerous measures that are more refined (e.g., labor force participation, total employment, etc.), over time total population growth has provided a reasonable estimate for high-level analysis of the first component of economic growth.
General Economy
Last Updated
Oct 9, 2023
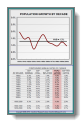
Inflation: Not Done Yet?
The big story for the remainder of 2023 will likely be inflation. Fed Chairman Powell intentionally avoided the implications underlying words like “pause” or “skip” when he said the Fed would “make our decisions meeting by meeting, based on the totality of incoming data.” Let’s look at a structural element that will influence the upcoming inflation data.
June’s Consumer Price Index (CPI) likely will continue this year’s underlying trend of lower inflation… hurrah! But, mid-year is likely to be the inflection point toward higher inflation reports into year-end. Those calls are far from certain, yet recent history significantly drives the future.
CPI inflation is reported on a year-over-year basis as a percentage increase (or decrease). The percentage change is based on the CPI Index, which is a cumulative measure of price inflation expressed as a number with three decimal places.
For example, May’s CPI Index of 304.127 is divided by May 2022’s CPI Index of 292.296 to calculate an annual inflation percentage rate presented with one decimal place (i.e., 4.0%).
Thus, the “annual inflation rate” for each month is the percentage increase of this year’s CPI Index over last year’s CPI Index for each respective month of the year. As a result, the value last year significantly influences this year’s percentage!
The blue line in this graph reflects the index value for each month of 2022. The solid red line reflects the five reports thus far in 2023 (through May 2023). As the gap between the lines narrowed over the past five months, the rate of increase narrowed (i.e., decreased), providing the declining annual inflation rate reflected by the solid green line (i.e., from 6.4% to 4.0%).
However, the second half of 2022 experienced a stall for the CPI Index. Nonetheless, inflation remained high across 2022 because of the relatively low CPI Index for each respective month of 2021. The STALL in 2022 set the stage for this year’s increase.
If each month’s inflation rate through year-end 2023 proceeds at an annualized 3% rate (as reflected by the dashed red line), the resulting increase in each month’s index will drive an increasing annual inflation rate over last year’s stalled level (i.e., the green dashed line). Note the widening of the expected gap for the next six months between this year’s and last year’s CPI Index.
A constant 0.247% monthly inflation rate (i.e., a 3% annualized rate) for the rest of 2023 is very unlikely. Instead, this analysis aims to identify and communicate key factors that will impact the reported inflation measures through year-end.
The progression of inflation has major implications for the likely press reports (and the corresponding pressure on the Fed)… and the compounding effects that both could have on the financial markets.
Updated
Through Dec 2023
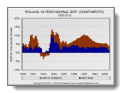
GDP – Nominal: 10-Year Rolling Components
Nominal GDP consists of real GDP plus inflation. This chart presents the two components of nominal GDP for all 10-year periods since 1900. The 10-year periods smooth some of the variability of economic growth and the inflation rate to display the contributions of each component over longer periods. Of particular note, the loss of real economic growth during the 1930s was made up in subsequent decades thereby restoring the long-term trend of fairly stable real economic growth over time. Unlike the 1930s, it’s unclear if the economy over the next few decades will make up and return to its long-term average real rate of growth.
Updated
Through Dec 2023
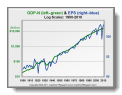
GDP – Nominal & EPS
Nominal GDP and earnings per share (EPS) have a close and fundamental relationship. Nominal GDP is driven by the economic cycle, with real GDP providing core growth and the inflation rate adding a degree of variability over time. Earnings growth is driven by the business cycle, which revolves around the economic cycle with swings that have greater magnitude and frequency. The primary driver for the core baseline of earnings over time is nominal economic growth (yet GDP does not consistently drive EPS in the short-run).